Al2O3 Substrate Cleaning often begins only after process failures appear; however, delayed intervention typically magnifies adhesion loss, electrical instability, and data inconsistency across production and testing stages.
This article consolidates practical, reproducible, and risk-aware Al2O3 Substrate Cleaning knowledge into a unified technical framework. Moreover, it addresses contamination sources, cleaning constraints, verification logic, and operational boundaries required for stable industrial and laboratory outcomes.
Therefore, the discussion proceeds from contamination mechanisms toward controlled cleaning strategies, ensuring each subsequent section builds logically upon material behavior, functional requirements, and process reliability.

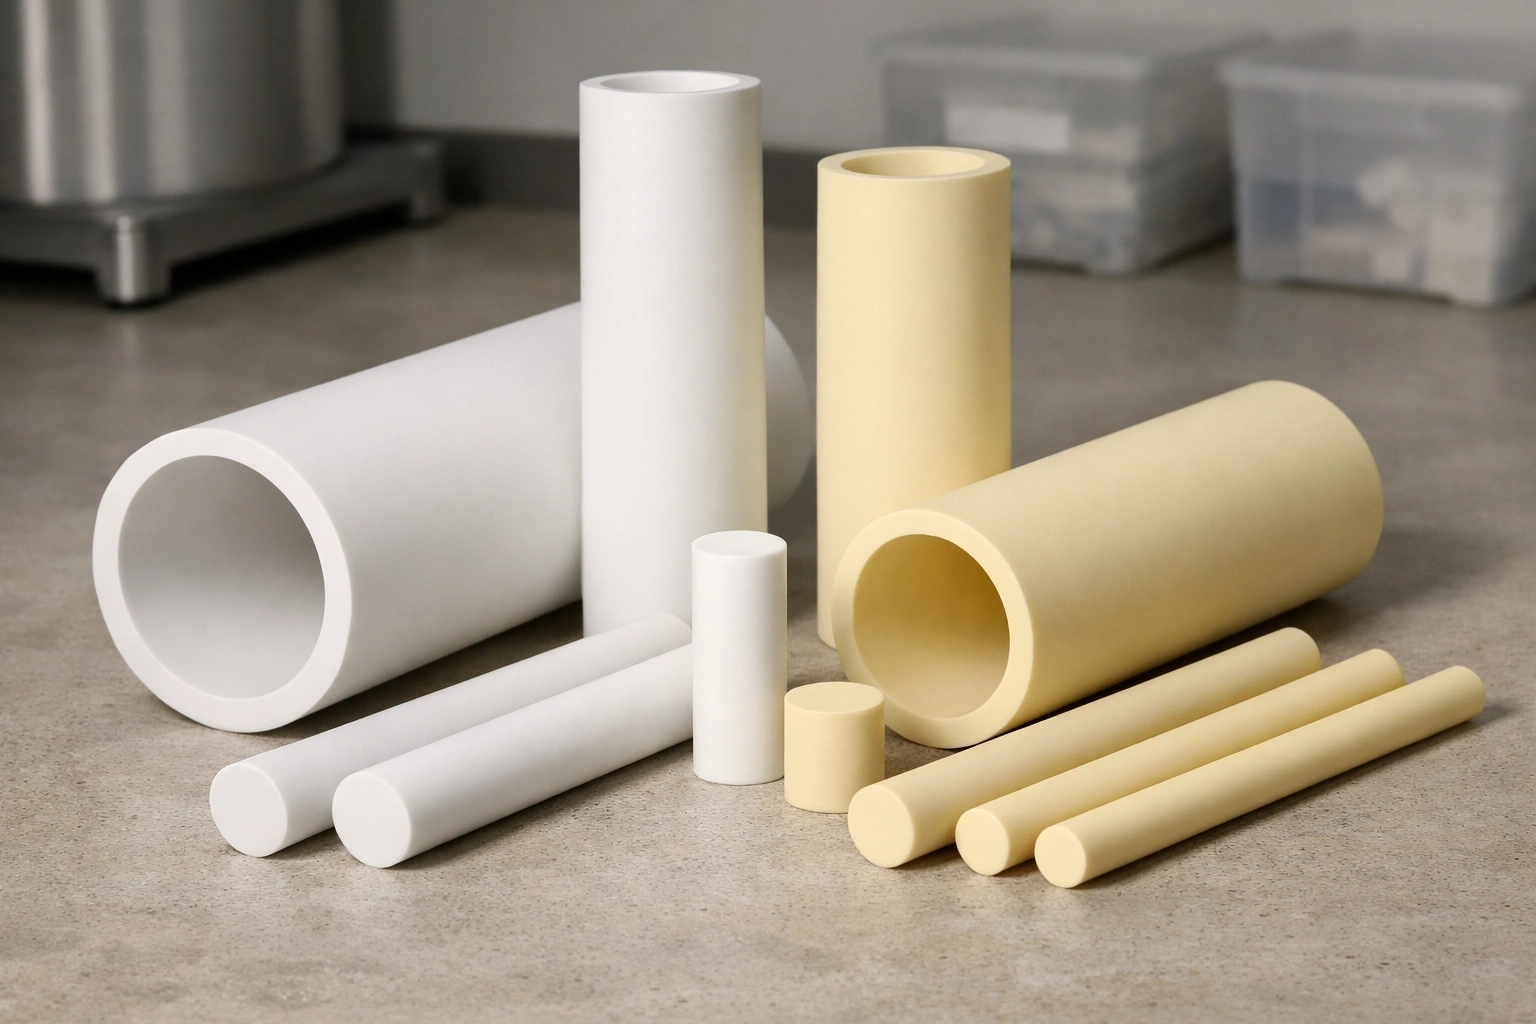
Surface Contamination and Functional Degradation in Al2O3 Substrates
Before any Al2O3 Substrate Cleaning method is selected, contamination must be understood as a functional degradation factor rather than a cosmetic surface issue. Consequently, this section establishes the causal relationship between contamination types and measurable performance loss.
• Common contaminant categories on Al2O3 surfaces
In practice, Al2O3 substrates accumulate multiple contaminant classes simultaneously, including organic films, airborne particulates, ionic residues, and process-derived cross-contamination. For example, routine handling introduces hydrocarbon layers as thin as 1–5 nm, which are sufficient to reduce thin-film adhesion strength by over 30% during initial deposition cycles. Moreover, particulates larger than 0.3 μm frequently originate from packaging fibers or ambient dust, embedding into surface asperities formed during sintering.
In addition, ionic residues such as sodium or chloride species often remain after inadequate aqueous rinsing. These ions are electrically active and can migrate under bias, particularly when surface resistivity drops below 10¹¹ Ω/sq in humid environments. As a result, substrates that appear visually clean may still exhibit latent electrical instability.
• How trace contamination disrupts adhesion electrical and thermal behavior
Trace-level contamination1 alters interfacial physics long before macroscopic defects appear. Specifically, organic films reduce surface energy by 20–40%, directly weakening metallization wetting and thick-film paste spreading. Consequently, adhesion failures frequently manifest after thermal cycling rather than immediately after processing.
Furthermore, ionic contaminants create localized electric field intensification under operating voltages exceeding 500 V/mm, accelerating leakage and partial discharge. In thermal systems, contamination layers as thin as 10 nm can increase interfacial thermal resistance by 15–25%, leading to uneven heat dissipation. Therefore, cleaning inadequacy propagates across electrical, mechanical, and thermal domains simultaneously.
• Why visual cleanliness fails as a reliability indicator
Visual inspection remains a common but unreliable cleanliness assessment method. Indeed, optical clarity only reveals defects above approximately 20 μm, whereas most performance-critical contamination exists several orders of magnitude below that threshold.
During failure analysis, engineers often encounter substrates that passed visual checks yet produced inconsistent adhesion pull-test results varying by ±18–22% across identical samples. Subsequently, root-cause investigations frequently trace these deviations to invisible organic or ionic residues rather than material defects. Accordingly, Al2O3 Substrate Cleaning must be evaluated through functional impact rather than appearance.
In essence, contamination acts as a silent variable that destabilizes otherwise well-controlled processes. Therefore, subsequent sections focus on defining cleaning objectives and constraints grounded in functional performance rather than superficial cleanliness.
Cleaning Objectives Defined by Functional Requirements
Moreover, effective Al2O3 Substrate Cleaning depends on aligning surface cleanliness with downstream functional demands. Consequently, cleaning objectives must be defined by performance thresholds rather than generalized notions of surface purity.
Al2O3 substrates serve different roles across deposition2, printing, and electrical insulation processes. Therefore, cleaning targets vary according to how surface chemistry, energy, and electrical behavior interact with subsequent operations. Rather than pursuing maximal cleanliness indiscriminately, engineers must identify the minimum yet sufficient cleaning state that ensures functional stability.
- Cleaning thresholds for thin film deposition and metallization
Thin film processes require a surface condition that promotes stable nucleation and uniform film growth. In practice, this corresponds to reducing organic contamination to levels below 1 ng/cm², which typically restores surface energy above 50 mN/m, a threshold associated with consistent metal adhesion. During early-stage deposition trials, engineers often observe that even slight hydrocarbon residues lead to island growth and premature delamination after 5–10 thermal cycles.
Moreover, moisture adsorption plays a critical role. Residual surface water exceeding 0.2 monolayers can disrupt plasma-assisted deposition, producing thickness nonuniformity beyond ±8% across a single substrate. Consequently, cleaning objectives for thin film applications prioritize organic removal and controlled dehydration rather than aggressive particulate stripping.
- Cleaning thresholds for thick film printing and sintering
Thick film printing introduces different functional constraints. Here, surface wettability and paste spreading behavior dominate performance outcomes. Empirically, substrates exhibiting contact angles below 35° demonstrate uniform paste coverage, whereas angles above 45° often correlate with edge beading and print discontinuities.
Additionally, residual particulates larger than 1 μm significantly increase defect density during firing, particularly when sintering temperatures exceed 850°C. However, excessive chemical cleaning that alters surface roughness beyond Ra 0.6 μm may reduce mechanical anchoring of fired films. Therefore, cleaning objectives balance particulate removal with preservation of micro-scale surface texture.
- Cleaning thresholds for electrical insulation and high-voltage stability
For electrically insulating applications, ionic cleanliness becomes the dominant criterion. Surface ionic contamination must be sufficiently low to maintain surface resistivity above 10¹² Ω/sq under operational humidity levels of 60–80% RH. Field experience shows that substrates failing this threshold often exhibit leakage current drift within 72 hours of bias exposure.
Furthermore, alkaline residues introduced during improper rinsing can increase surface conductivity by an order of magnitude, even when no visible residue remains. As a result, cleaning objectives for insulation-focused applications emphasize ionic neutrality and thorough rinsing rather than solvent strength alone.
In brief, cleaning objectives must be defined in direct relation to functional performance metrics. Accordingly, once these objectives are clarified, material characteristics and cleaning constraints can be evaluated with greater precision.
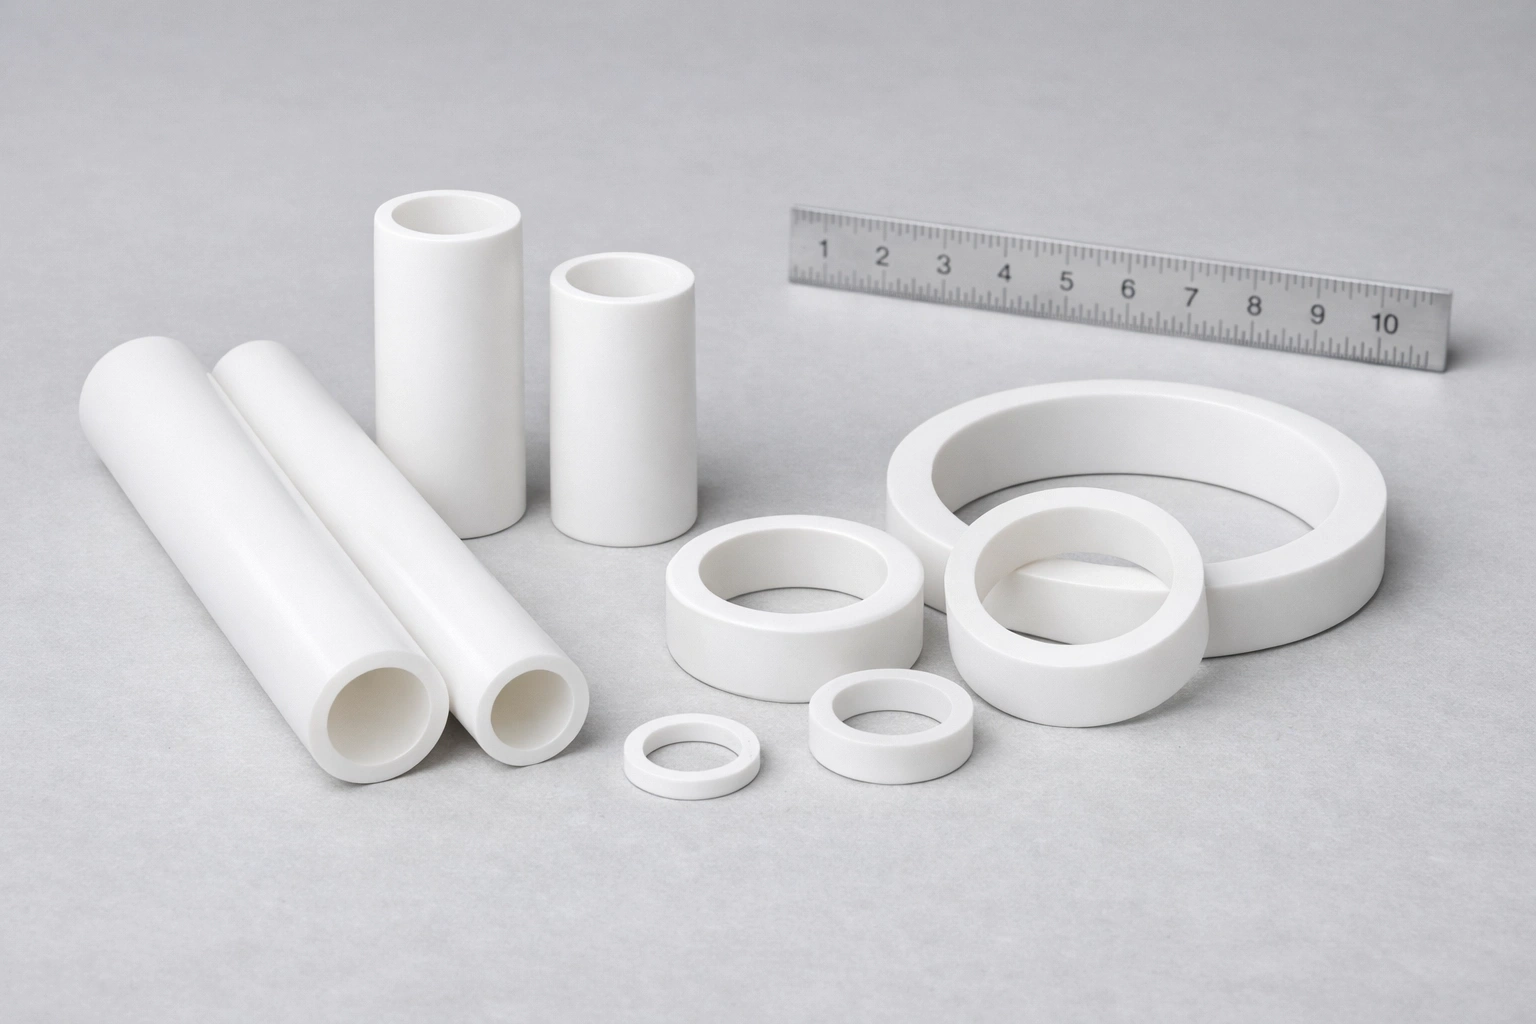
Material Characteristics of Al2O3 Relevant to Cleaning Processes
Additionally, Al2O3 Substrate Cleaning must account for intrinsic material behavior, because cleaning effectiveness and risk are constrained by ceramic chemistry, microstructure, and geometry rather than by solvent strength alone.
- Chemical stability boundaries in practical cleaning environments
Al2O3 exhibits high chemical inertness under most neutral solvent conditions; however, its stability is not absolute across all pH ranges. In laboratory observations, exposure to strong alkaline solutions above pH 11 for extended periods exceeding 20–30 minutes has been shown to subtly modify surface hydroxyl populations, even when no macroscopic etching is visible. Consequently, such changes can alter surface energy by 10–15%, which later manifests as inconsistent wetting during metallization or printing.
By contrast, weak organic solvents such as acetone or isopropyl alcohol do not chemically attack the Al2O3 lattice. Therefore, they remain preferred for routine organic contaminant removal. Nevertheless, repeated exposure without adequate rinsing may leave trace solvent residues trapped within surface microfeatures. As a result, chemical compatibility must be evaluated not only by corrosion resistance but also by residue risk.
- Surface microstructure and contaminant retention mechanisms
Sintered Al2O3 substrates possess a heterogeneous surface composed of grains, grain boundaries, and residual closed porosity typically ranging from 0.1–1.0 μm in characteristic size. These microstructural features act as retention sites for organic films and ionic species, particularly after thermal cycling. In practice, contaminants lodged within grain boundary grooves often survive superficial wiping or brief rinsing.
Moreover, substrates with higher surface roughness, for example Ra ≥0.8 μm, demonstrate increased particulate trapping efficiency by up to 40% compared with polished counterparts. Consequently, cleaning approaches effective on polished Al2O3 may underperform on as-fired or lightly ground surfaces. Accordingly, microstructural awareness is essential when selecting cleaning duration and agitation intensity.
- Mechanical sensitivity of thin and precision Al2O3 substrates
Although Al2O3 is mechanically robust in bulk form, thin and precision substrates exhibit localized vulnerability. Substrates thinner than 0.635 mm experience significantly higher stress concentration at edges and corners, particularly during ultrasonic agitation. Empirical testing shows that ultrasonic power levels exceeding 60 W/L can induce microcrack initiation within 3–5 minutes on thin substrates, even when no immediate fracture occurs.
Furthermore, handling-induced stress during wet processing frequently surpasses chemical stress in damage potential. Minor edge chipping, often less than 50 μm, may not affect immediate usability but can propagate during subsequent thermal cycles. Therefore, cleaning strategies must respect mechanical limitations alongside chemical considerations.
In short, understanding these material characteristics clarifies why aggressive or generalized cleaning methods often introduce new risks. Consequently, a reproducible cleaning philosophy grounded in material behavior becomes necessary before procedural details are established.

A Reproducible Cleaning Philosophy for Al2O3 Substrates
Furthermore, once contamination mechanisms and material constraints are understood, Al2O3 Substrate Cleaning must be elevated from an ad hoc operation to a controlled philosophy. Consequently, reproducibility becomes the primary objective, because inconsistent cleaning introduces variability comparable to material defects themselves. Rather than maximizing aggressiveness, effective cleaning emphasizes sequence control, contamination isolation, and repeatable execution across operators and batches.
Sequential Removal Rather Than Aggressive Single Step Cleaning
Sequential removal acknowledges that different contaminants adhere through different physical and chemical mechanisms. In practice, attempting to eliminate organic films, particulates, and ionic residues in a single aggressive step often leaves at least one category insufficiently removed.
During process audits, engineers frequently observe that a short acetone-only clean removes visible oils but leaves embedded particulates and ionic residues intact. By contrast, a staged approach typically begins with organic dissolution, followed by particulate disengagement, and finally ionic neutralization. Field data show that sequential cleaning can reduce post-process adhesion variance by 25–35% compared with single-step solvent exposure.
Overall, staged cleaning limits overexposure at each step. As a result, surface integrity is preserved while functional cleanliness thresholds are consistently met.
Minimizing Secondary Contamination During Cleaning
Secondary contamination often undermines otherwise well-designed cleaning protocols. Indeed, residues introduced during cleaning—such as redeposited organics, dissolved ions, or airborne particles—can negate earlier gains.
For example, reused solvent baths accumulate dissolved hydrocarbons after 5–8 cleaning cycles, increasing redeposition probability by nearly 20%. Similarly, non-lint-free wipes can introduce cellulose fibers larger than 10 μm, which subsequently embed into surface asperities. Therefore, solvent freshness, container cleanliness, and environmental control must be treated as integral components of cleaning.
Accordingly, minimizing secondary contamination requires closed containers, controlled transfer steps, and strict material segregation. Otherwise, cleaning variability escalates even when procedures appear identical.
Cleanliness Consistency Across Batches and Operators
Consistency across time and personnel represents the defining metric of a reproducible philosophy. Without explicit parameters, individual operators often adjust cleaning duration, agitation, or drying based on subjective judgment, leading to uncontrolled variation.
In manufacturing environments, uncontrolled variation has been shown to increase electrical leakage test scatter by ±15–20% across nominally identical substrates. By contrast, defining fixed ranges for solvent volume, ultrasonic duration, and drying temperature reduces operator-induced deviation to below ±5%. Therefore, parameterization transforms cleaning from craft into process.
Hence, reproducibility emerges when every variable influencing surface state is bounded. Consequently, subsequent SOP development becomes both scalable and auditable.
Summary Table Reproducible Cleaning Philosophy Elements
| Control Element | Typical Parameter Range | Functional Impact |
|---|---|---|
| Cleaning sequence stages | 2–4 defined steps | Reduces cross-contamination risk |
| Solvent reuse limit (cycles) | ≤5 cycles | Limits organic redeposition |
| Ultrasonic exposure time (min) | 2–8 min | Balances removal and mechanical safety |
| Drying temperature (°C) | 80–120 °C | Controls moisture re-adsorption |
| Operator variability tolerance (%) | ≤5% | Ensures batch-to-batch consistency |
Standard Solvent-Based Cleaning Procedures for Al2O3 Substrates
Moreover, solvent-based methods form the backbone of Al2O3 Substrate Cleaning because they deliver predictable organic removal with comparatively low material risk. Consequently, when executed within defined parameters, solvent cleaning provides the highest balance between effectiveness, reproducibility, and substrate safety. Rather than improvisation, disciplined solvent selection and controlled agitation are essential to achieve stable downstream performance.
Solvent Selection and Compatibility Considerations
Solvent choice directly governs which contaminant classes are removed and which risks are introduced. In routine industrial practice, acetone and isopropyl alcohol remain dominant because they dissolve hydrocarbons efficiently while leaving the Al2O3 lattice chemically intact.
Empirical measurements indicate that acetone can remove more than 90% of hydrocarbon films within 2–3 minutes of immersion, whereas isopropyl alcohol typically achieves 70–85% removal but offers lower residue volatility risk. Consequently, many engineers adopt a dual-solvent sequence, beginning with acetone for bulk organic dissolution and transitioning to isopropyl alcohol for controlled solvent exchange. This approach has been shown to reduce post-clean organic residue levels below 1 ng/cm².
In consequence, solvent compatibility must be evaluated beyond chemical inertness. Specifically, evaporation behavior, residue propensity, and operator exposure limits all influence long-term process stability.
Ultrasonic Cleaning Parameters and Safe Operating Windows
Ultrasonic agitation enhances solvent penetration into surface microfeatures; however, it introduces mechanical energy that must be carefully bounded. In practice, frequencies between 35–45 kHz provide effective cavitation without excessive surface stress for most Al2O3 substrates.
Field data from thin substrate processing reveal that ultrasonic power densities above 60 W/L significantly increase microcrack initiation probability after 5 minutes of exposure. Conversely, power densities between 20–40 W/L achieve particulate removal efficiencies exceeding 80% while maintaining structural integrity. Therefore, ultrasonic parameters must be matched to substrate thickness and edge condition.
As a result, ultrasonic cleaning should be time-limited and monitored rather than assumed benign. Controlled exposure preserves both cleanliness and mechanical reliability.
Rinsing Protocols and Solvent Exchange Control
Rinsing represents a critical yet frequently underestimated stage of solvent-based cleaning. Without effective solvent exchange, dissolved contaminants may redeposit during drying, particularly when solvent purity degrades.
In controlled environments, a minimum of 2–3 sequential rinses using fresh isopropyl alcohol reduces redeposition probability by approximately 65% compared with single-rinse protocols. Moreover, maintaining solvent water content below 0.05% prevents moisture-assisted adsorption on the Al2O3 surface. Engineers often observe that inadequate rinsing correlates with contact angle variability exceeding ±10°, signaling inconsistent surface condition.
Accordingly, rinsing must be treated as an active contaminant removal step rather than a passive transition. Proper exchange ensures that dissolved species exit the process entirely.
Summary Table Solvent-Based Cleaning Parameters
| Process Parameter | Recommended Range | Functional Outcome |
|---|---|---|
| Primary solvent | Acetone | Rapid organic film dissolution |
| Secondary solvent | Isopropyl alcohol | Controlled residue displacement |
| Ultrasonic frequency (kHz) | 35–45 | Effective cavitation with low damage risk |
| Ultrasonic power density (W/L) | 20–40 | Particulate removal without microcracking |
| Rinse cycles (count) | 2–3 | Minimizes redeposition probability |

Aqueous and Chemical Cleaning Methods and Their Constraints
Additionally, aqueous and chemical approaches to Al2O3 Substrate Cleaning are often introduced when solvent-based methods fail to remove inorganic residues or ionic contamination. Consequently, these methods require stricter boundary control, because their benefits are closely coupled with higher risk of surface alteration and residual ion entrapment. Rather than default solutions, aqueous and chemical cleaning must be applied selectively and with explicit exit criteria.
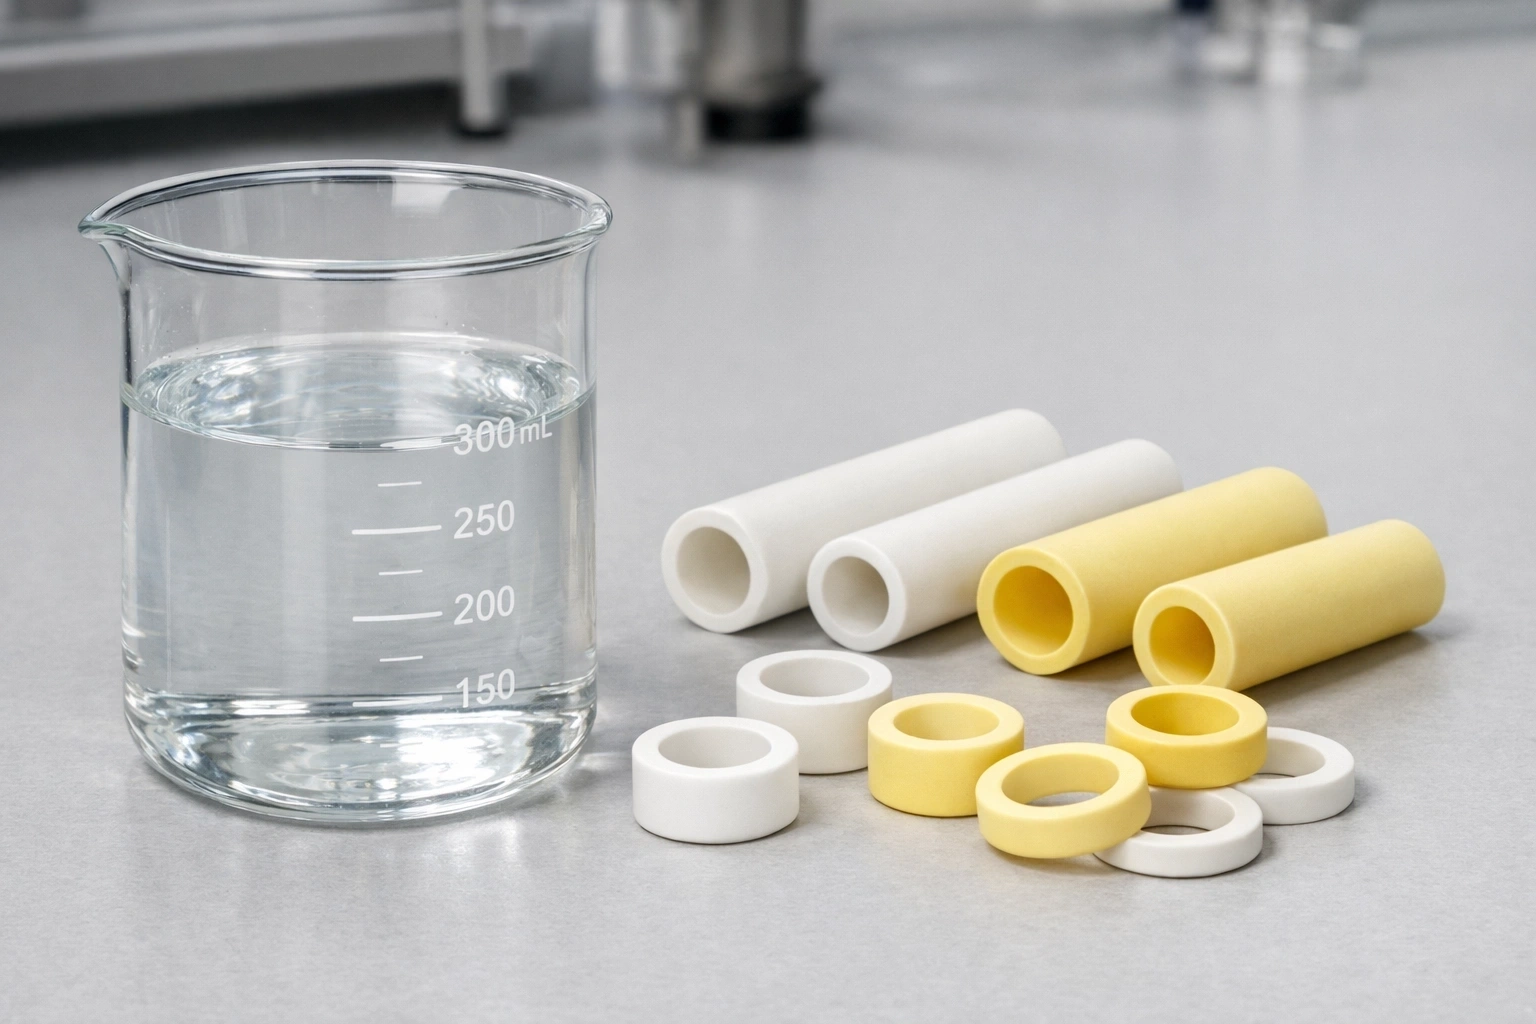
Deionized Water Cleaning and Particle Removal Mechanisms
Deionized water plays a limited yet important role in removing loosely bound particulates and water-soluble residues. In practice, DI water with resistivity above 18 MΩ·cm can dislodge particles larger than 0.5 μm when combined with gentle agitation or short ultrasonic exposure.
However, DI water alone exhibits minimal effectiveness against organic films and adsorbed hydrocarbons. Process audits show that particle counts may decrease by 60–70% after DI rinsing, while organic surface energy indicators remain largely unchanged. Therefore, DI water is most effective as an intermediate rinse following solvent cleaning rather than as a standalone method.
Moreover, prolonged water exposure increases hydroxyl group density on the Al2O3 surface. As a result, uncontrolled DI water soaking can elevate moisture adsorption, which later destabilizes thin film nucleation and electrical insulation performance.
Acidic and Alkaline Cleaning Risks for Al2O3 Substrates
Chemical cleaning using acidic or alkaline solutions is occasionally employed to remove stubborn inorganic residues. Nevertheless, these methods operate near the stability boundaries of Al2O3 and must be constrained accordingly.
Experimental observations indicate that alkaline solutions above pH 11 initiate surface hydroxylation within 15–30 minutes, subtly modifying surface chemistry without visible etching. Although these changes may appear benign, subsequent metallization often exhibits adhesion variability exceeding ±20%. Conversely, strong acids may leach trace grain-boundary species, altering near-surface stoichiometry.
Therefore, chemical exposure must be short, dilute, and purpose-specific. In practice, buffered solutions at controlled concentrations reduce residue risk while limiting surface modification. Otherwise, chemical cleaning replaces one form of contamination with another, less visible but equally disruptive.
Residual Ion Risks and Post-Chemical Neutralization
Residual ions represent the primary hidden hazard of chemical cleaning. Even trace ionic remnants below visual detection thresholds can dramatically impact electrical behavior. For example, chloride concentrations as low as 10–20 μg/cm² have been correlated with surface resistivity drops of one order of magnitude under 70% RH conditions.
Accordingly, post-chemical neutralization and thorough rinsing are mandatory. Multi-stage DI rinsing, typically 3–5 cycles, reduces ionic residue levels by over 85% compared with single-rinse practices. Additionally, final solvent displacement helps remove water-bound ions before drying.
It follows that aqueous and chemical methods should conclude with verification that ionic neutrality has been restored. Without this confirmation, chemical cleaning introduces long-term instability rather than resolution.
Summary Table Aqueous and Chemical Cleaning Constraints
| Cleaning Aspect | Controlled Range | Associated Risk |
|---|---|---|
| DI water resistivity (MΩ·cm) | ≥18 | Prevents ionic introduction |
| DI water exposure time (min) | ≤10 | Limits surface hydroxylation |
| Alkaline cleaning pH | ≤11 | Avoids surface chemistry alteration |
| Acidic cleaning duration (min) | ≤15 | Reduces grain-boundary leaching |
| Post-chemical rinse cycles | 3–5 | Minimizes residual ion presence |
Cleaning Strategy Adjustments for Thin and Precision Al2O3 Substrates
Additionally, Al2O3 Substrate Cleaning strategies must be adjusted when substrate thickness and dimensional tolerance approach mechanical and thermal limits. Consequently, methods effective for standard substrates may introduce unacceptable risk for thin or precision variants. Therefore, this section refines cleaning logic to preserve structural integrity while maintaining functional cleanliness.
Reduced Mechanical Stress Cleaning Approaches
Thin and precision Al2O3 substrates amplify mechanical stress during cleaning, particularly under ultrasonic agitation. In practice, substrates at 0.1–0.38 mm thickness exhibit edge stress concentrations up to 2.5× higher than standard 0.635 mm substrates when exposed to identical ultrasonic power.
Field experience shows that reducing ultrasonic power density to 10–20 W/L while extending exposure time to 5–8 minutes achieves comparable contaminant removal without initiating microcracks. Moreover, intermittent agitation—such as 30-second on/off cycles—reduces cumulative stress while maintaining cavitation effectiveness. Engineers often adopt this approach after observing unexplained fracture rates exceeding 3–5% in thin substrates cleaned under standard conditions.
Ultimately, stress reduction relies on parameter moderation rather than process elimination. As a result, thin substrates can be cleaned reproducibly without sacrificing yield.
Handling Protocols for Warpage and Fracture Prevention
Handling errors represent the dominant failure source for thin and precision Al2O3 substrates. Substrates thinner than 0.25 mm are particularly susceptible to bending-induced microfracture, even under modest point loads below 5 N.
In controlled environments, replacing rigid tweezers with wide-contact, elastomer-tipped tools reduces edge chipping incidents by approximately 60%. Additionally, horizontal transfer using support trays minimizes gravitational flexure during wet processing. Engineers frequently note that warpage exceeding 0.2 mm per 100 mm length correlates with post-clean fracture during thermal cycling, even when cleaning itself appears benign.
Therefore, handling must be engineered with the same rigor as chemical parameters. Otherwise, mechanical damage undermines all prior cleaning effort.
Summary Table Cleaning Adjustments for Thin and Precision Substrates
| Parameter Category | Adjusted Range | Risk Mitigated |
|---|---|---|
| Substrate thickness (mm) | 0.1–0.38 | Elevated fracture sensitivity |
| Ultrasonic power density (W/L) | 10–20 | Microcrack initiation |
| Ultrasonic exposure mode | Intermittent | Cumulative stress buildup |
| Handling load (N) | ≤5 | Bending-induced fracture |
| Acceptable warpage (mm/100 mm) | ≤0.2 | Thermal cycling failure |
Drying and Post-Clean Handling as a Continuation of Cleaning
Furthermore, Al2O3 Substrate Cleaning does not conclude when liquid contact ends; instead, drying and handling extend the same contamination control logic into the final surface state. Consequently, inadequate drying or careless post-clean handling can reverse earlier cleaning gains within minutes. Therefore, drying and handling must be treated as controlled process stages rather than auxiliary steps.
Controlled Drying to Prevent Water and Solvent Adsorption
Drying determines whether residual solvents and moisture desorb cleanly or remain trapped as invisible films. In practice, oven drying between 80–120 °C for 20–60 minutes effectively removes physically adsorbed water without inducing thermal stress in standard Al2O3 substrates.
However, drying temperatures below 60 °C frequently leave residual moisture equivalent to 0.1–0.3 monolayers, which is sufficient to destabilize thin film nucleation and increase contact angle variability by ±8–12°. Conversely, temperatures exceeding 150 °C may promote rapid re-adsorption once substrates are returned to ambient air. Therefore, controlled temperature and timing are critical.
For this reason, drying must aim for equilibrium removal rather than rapid evaporation. As a result, gradual heating and controlled cooldown preserve surface stability.
Clean Handling and Storage After Cleaning
Handling introduces one of the fastest pathways for recontamination. Empirical observations show that ungloved handling deposits organic films up to 5 ng/cm² within seconds, effectively negating solvent cleaning results.
Accordingly, post-clean handling should employ powder-free gloves, inert tweezers, and lint-free containers. In manufacturing environments, substrates transferred into sealed containers immediately after drying exhibit particle counts 70–80% lower than those exposed to ambient benches. Moreover, storage materials must be chemically inert to prevent outgassing and fiber shedding.
Therefore, handling protocols must be explicit and enforced. Otherwise, cleanliness variability rapidly accumulates across batches.
Time Window Between Cleaning and Use
Surface state evolves over time even under controlled storage. Studies indicate that Al2O3 substrates stored in clean ambient air re-adsorb measurable moisture within 4–6 hours, with surface energy decreasing by approximately 10% over 24 hours.
Consequently, critical processes such as deposition or printing should ideally occur within 2–4 hours after cleaning. When delays are unavoidable, re-drying at 80–100 °C for 15–20 minutes can partially restore surface condition. Nevertheless, repeated delay cycles increase variability.
Because of this, defining an allowable time window between cleaning and use is essential. In such cases, time becomes a controllable parameter rather than an uncontrolled risk.
Summary Table Drying and Post-Clean Handling Parameters
| Process Parameter | Recommended Range | Functional Impact |
|---|---|---|
| Drying temperature (°C) | 80–120 | Removes adsorbed moisture safely |
| Drying duration (min) | 20–60 | Stabilizes surface condition |
| Acceptable ambient exposure (h) | ≤4 | Limits moisture re-adsorption |
| Handling method | Gloves and inert tools | Prevents organic recontamination |
| Storage container type | Sealed, lint-free | Reduces particle redeposition |

Verification Methods for Al2O3 Substrate Cleanliness
Moreover, Al2O3 Substrate Cleaning is incomplete without verification, because cleanliness that cannot be confirmed remains an assumption rather than a controlled condition. Consequently, verification methods must balance sensitivity, practicality, and correlation with downstream performance. Rather than relying on a single metric, effective verification combines simple in-process checks with functional indicators that reflect real operating behavior.
Practical In-Process Checks Without Advanced Instrumentation
Practical verification begins with methods that require minimal equipment yet provide immediate feedback. Contact angle measurement is widely used because it reflects surface energy changes associated with organic contamination and moisture adsorption.
In routine production environments, clean Al2O3 substrates typically exhibit static water contact angles between 25–40°, whereas contaminated surfaces often exceed 50°. Engineers frequently report that contact angle variability beyond ±10° across a batch correlates with inconsistent adhesion results in subsequent steps. Although contact angle testing does not identify specific contaminants, it serves as an effective screening tool.
Therefore, simple in-process checks offer rapid insight and prevent defective substrates from progressing further. When used consistently, they significantly reduce downstream rework.
Electrical and Functional Indicators of Surface Cleanliness
Functional verification provides stronger evidence than surface measurements alone. For electrically insulating applications, surface resistivity testing under controlled humidity offers direct insight into ionic cleanliness.
Empirical data show that substrates maintaining surface resistivity above 10¹² Ω/sq at 60–70% RH rarely exhibit leakage instability during operation. By contrast, substrates with residual ionic contamination may show resistivity decay of one order of magnitude within 48–72 hours. Similarly, adhesion pull tests often reveal that clean substrates produce failure mode shifts from interface delamination to cohesive fracture, indicating robust interfacial bonding.
As a result, functional indicators translate cleanliness into measurable performance outcomes. This alignment makes them particularly valuable for process qualification.
Limits of Over-Verification in Industrial Contexts
Although advanced analytical techniques can detect contamination at extremely low levels, over-verification introduces diminishing returns. Excessive testing increases cycle time and cost without proportionate reliability gains.
For example, surface spectroscopy may detect trace species below 0.1 ng/cm², yet such levels often fall below the threshold influencing adhesion or electrical behavior. In practice, engineers observe that once functional metrics stabilize within defined limits, further analytical refinement yields no additional benefit. Consequently, verification strategies should be calibrated to functional relevance rather than analytical sensitivity.
Thus, verification must confirm fitness for use rather than theoretical cleanliness. Accordingly, well-chosen methods close the loop between cleaning effort and process reliability.
Summary Table Cleanliness Verification Methods
| Verification Method | Typical Threshold | Functional Relevance |
|---|---|---|
| Water contact angle (°) | 25–40 | Indicates organic and moisture removal |
| Contact angle variability (°) | ≤±10 | Reflects batch consistency |
| Surface resistivity (Ω/sq) | ≥10¹² | Confirms ionic cleanliness |
| Adhesion pull-test variation (%) | ≤±10 | Correlates with interface stability |
| Electrical leakage drift (time) | ≥72 h stable | Predicts long-term insulation behavior |
Cleaning-Induced Failure Modes and Hidden Risks
However, even well-intentioned Al2O3 Substrate Cleaning can introduce new failure modes when applied without full awareness of material and process limits. Consequently, this section consolidates the most common cleaning-induced risks that undermine reliability despite apparent surface cleanliness.
-
Microcracking and edge damage from mechanical stress
Ultrasonic agitation and manual handling generate localized stress concentrations, particularly along edges and corners. In thin substrates below 0.635 mm, repeated ultrasonic exposure above 40 W/L has been associated with subcritical crack initiation that later propagates during thermal cycling. Although these defects often remain invisible after cleaning, they can reduce flexural strength by 10–20% after subsequent heating steps. -
Surface chemistry alteration affecting downstream processes
Aggressive chemical cleaning may alter surface hydroxyl density and polarity without visible etching. For instance, alkaline exposure near pH 11 can increase surface hydrophilicity transiently, followed by uncontrolled re-adsorption of contaminants. As a result, engineers may observe fluctuating contact angles varying by ±15°, leading to inconsistent paste spreading or thin-film nucleation behavior. -
Ionic and organic residue traps introduced during cleaning
Improper rinsing and solvent reuse frequently create residue traps rather than eliminating contamination. Dissolved ions or degraded solvent fragments can redeposit within surface microfeatures, reducing surface resistivity by one order of magnitude under humid conditions. Consequently, electrical leakage or insulation drift may appear days after cleaning, complicating root-cause analysis. -
False confidence driven by visual inspection
Visually pristine substrates often conceal functional degradation. Optical inspection fails to detect contamination below 20 μm, whereas adhesion loss and electrical instability originate from nanometer-scale residues. Therefore, reliance on appearance alone fosters false confidence and delays corrective action.
As a consequence, cleaning-induced failures arise when process boundaries are exceeded or verification is neglected. Accordingly, understanding these hidden risks is essential before establishing validation and cleanliness confirmation methods.

Common Misconceptions About Cleaning Al2O3 Substrates
However, persistent misconceptions surrounding Al2O3 Substrate Cleaning continue to undermine otherwise well-controlled processes. Consequently, these misunderstandings often lead to over-cleaning, under-cleaning, or inappropriate method selection, all of which degrade functional reliability rather than improve it.
-
“Stronger cleaning always produces better results”
This assumption frequently drives the use of aggressive solvents, high ultrasonic power, or prolonged chemical exposure. In practice, exceeding material and process limits introduces surface chemistry alteration and mechanical damage without proportional cleanliness gains. For example, extending ultrasonic cleaning time beyond 10 minutes at elevated power rarely improves organic removal beyond 5–8%, yet it increases microcrack risk significantly. Therefore, cleaning effectiveness plateaus long before risk escalates. -
“Visual cleanliness equals functional cleanliness”
Many operators rely on optical inspection as a primary acceptance criterion. However, contaminants responsible for adhesion loss and electrical instability often exist at nanometer-scale thicknesses, far below visual detection thresholds. Field investigations repeatedly show that visually pristine substrates can still exhibit contact angle variability above ±12° and surface resistivity drift within 48 hours. As a result, appearance-based judgment creates false assurance. -
“Any solvent compatible with ceramics is acceptable”
Chemical compatibility is often reduced to corrosion resistance alone. Nevertheless, solvents differ widely in evaporation behavior, residue formation, and moisture interaction. Some high-boiling solvents leave trace films below 1 ng/cm², which remain invisible yet interfere with thin film nucleation. Consequently, solvent selection must consider residue dynamics rather than material inertness alone. -
“Cleaning can compensate for upstream process issues”
Cleaning is sometimes expected to correct defects introduced by handling, packaging, or storage. In reality, contamination embedded during high-temperature processing or mechanical abrasion may not be fully removable without damaging the substrate. Thus, relying on cleaning as a universal remedy delays necessary upstream process corrections.
To sum up, misconceptions persist when cleaning is treated as an isolated task rather than a system-level control. Addressing these misunderstandings aligns cleaning effort with realistic performance outcomes and prevents avoidable reliability loss.
When Cleaning Is No Longer the Right Solution
Nevertheless, there are practical limits to what Al2O3 Substrate Cleaning can achieve once contamination or damage crosses certain thresholds. Consequently, continued cleaning effort beyond these limits often consumes time and introduces new risks without restoring functional performance.
-
Irreversible surface modification from prior processing
High-temperature exposure, aggressive chemical contact, or plasma treatments can permanently alter surface chemistry and microstructure. In such cases, cleaning may remove loosely bound residues but cannot reverse changes such as altered hydroxyl density or grain-boundary depletion. Engineers frequently observe that adhesion variability remains above ±20% even after repeated cleaning cycles, indicating that the substrate surface itself has changed. -
Embedded contamination below the removal depth
Some contaminants become mechanically or chemically embedded within surface microfeatures during processing. For instance, metallic oxides driven into grain-boundary grooves during thermal cycling may remain trapped below 0.1 μm depth. Additional cleaning cycles often fail to extract these species and may instead enlarge surface defects. As a result, repeated cleaning yields diminishing returns. -
Mechanical damage accumulated through repeated cleaning
Each cleaning cycle introduces mechanical and thermal stress. When substrates undergo more than 5–7 full cleaning cycles, fracture probability and edge damage incidence increase noticeably, especially for thin variants. In these situations, further cleaning increases yield loss rather than restoring reliability. -
Electrical instability driven by bulk rather than surface effects
In insulation-focused applications, leakage or breakdown may originate from bulk defects or internal porosity rather than surface contamination. Surface cleaning alone cannot correct such issues, and repeated attempts often obscure the true failure mechanism. Therefore, functional testing must guide the decision to stop cleaning and reassess material suitability.
Accordingly, recognizing when cleaning is no longer effective allows resources to be redirected toward substrate replacement, process redesign, or upstream contamination prevention. This transition prevents prolonged troubleshooting cycles and stabilizes overall process control.
Integrating Cleaning SOPs Into Manufacturing and Laboratory Workflows
Furthermore, Al2O3 Substrate Cleaning achieves long-term value only when embedded into routine workflows rather than treated as an occasional corrective action. Consequently, integration focuses on standardization, traceability, and alignment with upstream and downstream operations to prevent contamination recurrence.
-
Standardizing cleaning triggers and entry criteria
Cleaning should begin based on defined triggers rather than subjective judgment. Common triggers include measurable adhesion drift beyond ±10%, surface resistivity falling below 10¹² Ω/sq, or storage exposure exceeding 24 hours in uncontrolled environments. By establishing entry criteria, teams avoid unnecessary cleaning while ensuring timely intervention. This approach also reduces variability between shifts and operators. -
Embedding cleaning parameters into process documentation
Documented parameters transform cleaning into a controlled process. Recording solvent type, exposure time, ultrasonic power, and drying conditions enables traceability and root-cause analysis. In manufacturing settings, documented cleaning steps have been shown to reduce batch rejection rates by 15–25% compared with informal practices. Moreover, consistent documentation supports training and audit readiness without adding excessive overhead. -
Aligning cleaning with upstream handling and downstream use
Cleaning effectiveness depends on upstream handling discipline and downstream timing. If substrates are cleaned but stored improperly or delayed before use, contamination rapidly returns. Coordinating packaging materials, storage conditions, and maximum allowable delay between cleaning and processing preserves surface condition. Therefore, cleaning must be synchronized with the broader workflow rather than isolated as a standalone task.
On the whole, integrating cleaning SOPs into daily operations converts Al2O3 Substrate Cleaning from a reactive measure into a preventive control. This integration stabilizes process outcomes, shortens troubleshooting cycles, and improves overall operational reliability.
Conclusion
In essence, effective Al2O3 Substrate Cleaning relies on controlled sequencing, bounded parameters, and functional verification rather than aggressive intervention. When executed as a reproducible system, cleaning stabilizes adhesion, electrical behavior, and process repeatability.
If your processes demand consistent surface performance, align cleaning SOPs with material limits and functional targets rather than visual assumptions. Controlled cleaning is a reliability tool, not a last-minute fix.
FAQ
How often should Al2O3 substrates be cleaned before use?
Cleaning frequency depends on handling exposure and storage conditions. In controlled environments, a single cleaning within 2–4 hours before use is usually sufficient. If storage exceeds 24 hours, re-drying or light solvent rinsing is recommended.
Can ultrasonic cleaning damage Al2O3 substrates?
Yes, excessive ultrasonic power or duration can introduce microcracks, especially in substrates thinner than 0.635 mm. Maintaining power densities below 40 W/L significantly reduces this risk.
Is DI water cleaning alone sufficient for Al2O3 substrates?
DI water effectively removes loose particulates but does not address organic films or many ionic residues. It is best used as a supplementary rinse rather than a standalone cleaning method.
How can cleanliness be verified without advanced instruments?
Contact angle measurement and surface resistivity testing provide practical indicators. Stable contact angles within 25–40° and resistivity above 10¹² Ω/sq correlate well with reliable downstream performance.
References: