Weibull modulus describes the spread of measured ceramic strength values for a defined material, specimen, test method, and flaw population. A higher modulus indicates a narrower strength distribution; a lower modulus indicates greater specimen-to-specimen variation. It does not measure elastic stiffness, and it does not show how strong the ceramic is by itself. Engineers must read it with characteristic strength, confidence bounds, specimen count, fracture origins, surface condition, and test configuration.
Why Does Ceramic Strength Vary?
Ceramic strength varies because brittle fracture commonly begins at the most severe effective flaw within a sufficiently stressed region. Pores, inclusions, agglomerates, machining scratches, edge chips, large grains, reaction layers, and handling damage are not identical in every specimen. Their position and orientation relative to tensile stress also differ.
Technical ceramics have limited plastic deformation at the crack tip, so they cannot redistribute local stress as readily as ductile metals. Nominally identical test bars therefore fail across a distribution of stresses rather than at one fixed material strength. Weibull analysis models this statistical behavior; it does not eliminate the need to determine where and why each specimen fractured.
Ceramics Fail from Critical Flaws, Not from an Average Microstructure
Failure occurs when local tensile stress acts on a sufficiently severe flaw and the crack-driving force exceeds the material’s resistance to crack extension. Fracture toughness, flaw geometry, residual stress, and applied stress all contribute. The average pore or grain size does not necessarily identify the fracture-controlling defect. One unusually large pore or sharp machining crack in the highly stressed region may matter more than thousands of smaller features.
This is the weakest-link concept behind ceramic strength statistics. Each specimen samples a different set of flaws. Its strength is largely controlled by the most critical member of that set—not by the average defect.
Surface, Edge, and Volume Flaws Are Different Populations
| Flaw Location | Possible Origins | Why It Matters |
|---|---|---|
| Surface | Grinding scratches, machining damage, handling contact, reaction layer | Finishing route can control flexural strength |
| Edge | Chipping, poor chamfer, cutting damage, edge contact | Edge failures may not represent the same population as face failures |
| Volume | Pores, inclusions, agglomerates, density gradients | A larger stressed volume may contain more potentially critical volume flaws |
| Assembly-induced | Point contact, interference fit, misalignment, clamp damage | May be absent from test bars but dominate finished-part failure |
Pooling these populations can produce a statistic that represents none of them well. A face-ground specimen that fails from machining damage should not automatically be analyzed with a specimen that fails from an internal inclusion. Fracture-origin classification is therefore part of the strength analysis, not merely a post-test curiosity.
Why “Same Material” Does Not Mean “Same Strength Distribution”
A material-family name such as alumina, zirconia, or silicon nitride does not define a strength distribution. Powder lot, forming route, sintering density, grain-size distribution, secondary phases, orientation, machining sequence, grinding direction, surface finish, edge preparation, and batch stability can all alter the active flaw population.
Even one grade can produce different distributions when test bars are cut in different orientations or finished by different processes. Supplier comparison must therefore align the grade, batch, specimen preparation, and test method before numerical Weibull parameters are ranked.
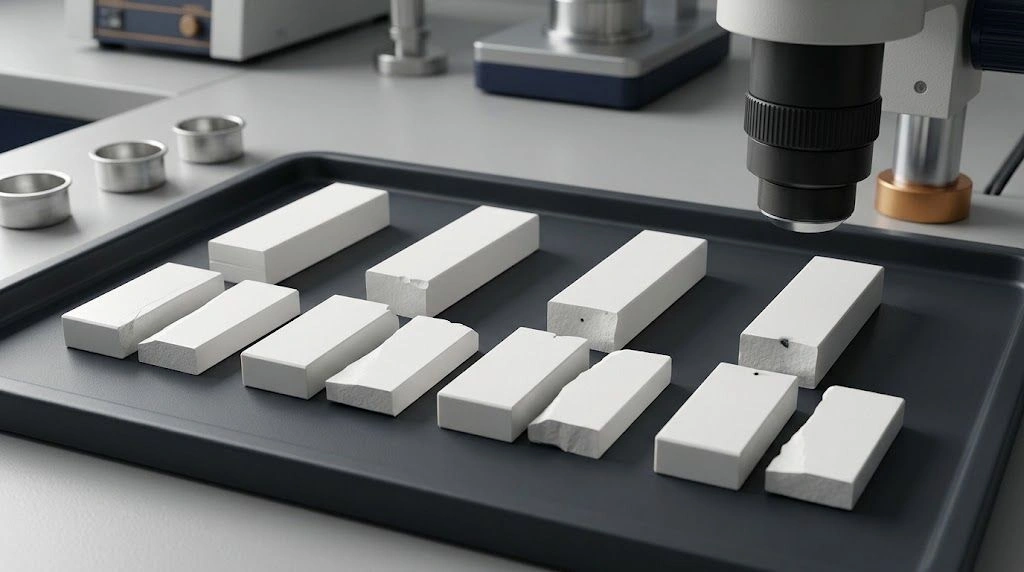
Nominally identical ceramic specimens can fail at different stresses because each contains a different most-critical flaw in the stressed region.
What Does Weibull Modulus Actually Mean?
The basic two-parameter Weibull model expresses failure probability as a function of applied stress:
[
P_f = 1-\exp\left[-\left(\frac{\sigma}{\sigma_0}\right)^m\right]
]
Here, (P_f) is modeled probability of failure, (\sigma) is applied stress under the reference condition, (\sigma_0) is characteristic strength, and (m) is the dimensionless Weibull modulus or shape parameter. A higher (m) creates a steeper distribution and less scatter; a lower (m) creates a wider distribution.
Characteristic strength sets the stress scale. When (\sigma=\sigma_0), the two-parameter equation gives (P_f=1-e^{-1}), approximately 63.2%, for the reference specimen and loading condition. Actual standards add defined estimation procedures, bias correction, confidence bounds, censoring, and qualified size-scaling provisions.
Read Weibull Modulus and Characteristic Strength Together
| Data Pattern | Weibull Modulus | Characteristic Strength | Engineering Interpretation |
|---|---|---|---|
| Narrow spread, high strength scale | Higher | Higher | Strong and comparatively consistent within the tested population |
| Narrow spread, low strength scale | Higher | Lower | Consistent, but consistently lower-strength specimens |
| Wide spread, high strength scale | Lower | Higher | High values may occur, but weak-tail risk remains important |
| Wide spread, low strength scale | Lower | Lower | Lower strength combined with substantial specimen variation |
Data Set A can have a high (m) but low (\sigma_0); Data Set B can have a lower (m) but higher (\sigma_0). Neither is automatically superior. The decision depends on allowable stress, target failure probability, component size, parameter uncertainty, and service conditions.
Characteristic Strength Is Not Minimum Strength
Characteristic strength is a fitted distribution parameter—not a guaranteed lower limit, minimum measured strength, or arithmetic mean. The 63.2% relationship belongs to the fitted two-parameter model for the reference population. It does not mean that 63.2% of every production component will fail at that stress, because component geometry, stressed area or volume, flaw population, surface condition, and environment may differ.
Weibull Modulus Is Not Elastic Modulus
Weibull modulus describes the shape of a statistical strength distribution and is dimensionless. Young’s modulus describes elastic stress–strain stiffness and is normally reported in GPa. They have unrelated physical meanings despite sharing the word “modulus.” Fracture toughness is different again: it measures resistance to crack extension under defined conditions.
| Parameter | Symbol | Meaning | Unit | Does Not Mean |
|---|---|---|---|---|
| Weibull modulus | (m) | Shape and spread of a fitted strength distribution | Dimensionless | Elastic stiffness or strength magnitude |
| Characteristic strength | (\sigma_0) | Stress-scale parameter at about 63.2% modeled failure probability | MPa | Minimum or guaranteed strength |
| Mean strength | (\bar{\sigma}) | Arithmetic average of measured failure stresses | MPa | Distribution shape or weak-tail behavior |
| Young’s modulus | (E) | Elastic stress–strain stiffness | GPa | Strength consistency |
| Fracture toughness | (K_{IC}) or method-specific equivalent | Resistance to crack extension | MPa·m¹ᐟ² | Strength distribution |
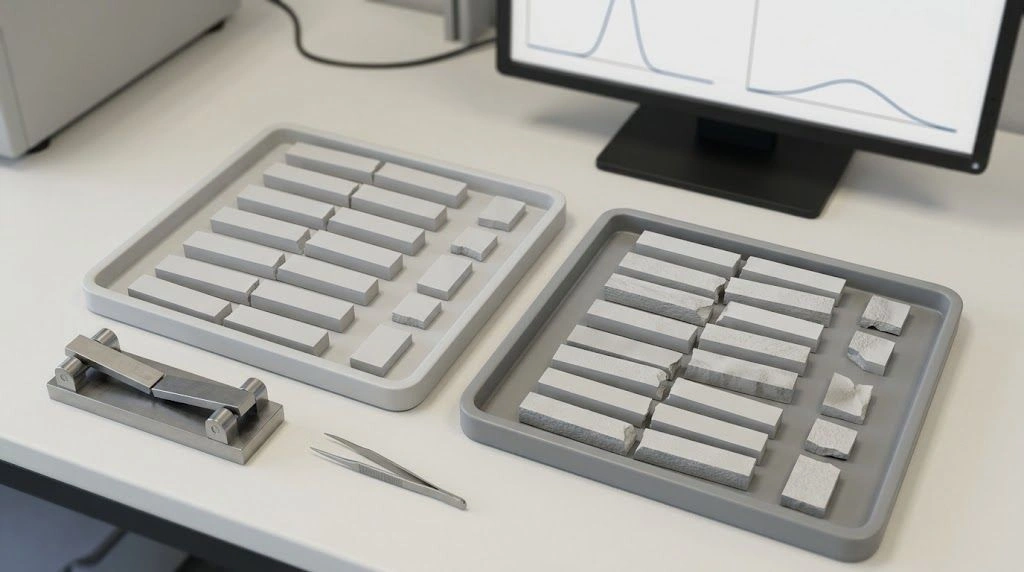
Weibull modulus describes the width of a strength distribution, while characteristic strength describes its stress scale.
How Should Ceramic Weibull Data Be Calculated and Checked?
A fitted modulus is only as credible as the strength data and failure classification behind it. ASTM C1239-13(2024)e1 covers reporting uniaxial strength data and estimating two-parameter Weibull distributions for advanced ceramics. ISO 20501:2019 addresses Weibull statistics for fine-ceramic strength data. ISO is developing a third edition, but the committee draft is not a published international standard.
These documents cannot turn poor testing into dependable design data. Specimen geometry and preparation must be controlled, experimental errors minimized, and fracture origins examined to determine whether the observations represent one flaw population or competing failure modes.
Sample Count Affects Uncertainty
Small datasets can produce unstable modulus estimates and wide confidence intervals. A NIST-authored systematic review discusses roughly 30 specimens as a general rule of thumb for useful Weibull strength parameters when no application-specific requirement controls. That is not a universal minimum or a guarantee of precision.
More specimens may be needed for tight confidence bounds, multiple batches, competing failure modes, qualification work, or predictions at low target failure probabilities. The applicable standard, expected scatter, risk level, and intended decision should control the sampling plan.
Use Maximum-Likelihood Estimation and Report Confidence Bounds
Standardized analysis uses defined statistical procedures rather than an informal trendline. ASTM C1239 details maximum-likelihood estimation, which is efficient and can address censored failure populations. Bias correction can be important, especially with limited samples. Reports should provide confidence bounds for both (m) and (\sigma_0); a modulus shown to several decimal places without uncertainty implies precision the program may not support.
Fracture Origins Must Be Classified
Inspect and classify face, edge, and volume failures, plus fixture/contact failures, handling damage, and invalid fractures outside the required region. Fractography or documented fracture-origin inspection helps distinguish material flaws from specimen-preparation and test artifacts. This classification also determines whether a single-population fit is defensible.
A Bent Weibull Plot May Be Engineering Information
A curved or kinked plot can indicate multiple flaw populations, mixed lots or finishes, edge and volume failures combined, misalignment, handling damage, small sample size, incorrect censoring, an unsuitable probability estimator, or non-Weibull behavior. A visibly bent plot should not be forced into a persuasive straight line without investigating the fracture origins and data provenance.
| Required Field | Why It Matters | Red Flag |
|---|---|---|
| Test standard and revision | Defines specimen and loading conditions | “Flexural strength test” with no standard |
| Tested and valid specimen counts | Controls parameter uncertainty | Modulus reported with no sample count |
| Estimation method | Affects fitted modulus and bias | Unidentified spreadsheet regression |
| Confidence bounds | Shows uncertainty in (m) and (\sigma_0) | One highly precise value |
| Fracture-origin classification | Tests the single-population assumption | Surface, edge, and fixture failures combined |
| Censored or excluded results | Prevents selective reporting | Weak specimens removed without explanation |
| Batch and surface condition | Defines the represented population | Multiple finishes or lots silently pooled |
Why Can a Finished Ceramic Part Be Weaker Than a Test Bar?
A Weibull distribution belongs to a defined specimen population and stress field. A larger part may expose more surface area or volume to high tensile stress, increasing the opportunity to encounter a severe flaw. A finished component can also contain bores, slots, thin walls, sharp radii, ground threads, contact points, assembly preload, and machining damage absent from a polished test bar.
Size scaling is meaningful only when the component and specimens share an applicable flaw population and the effective stressed area or volume is calculated correctly.
The Weakest-Link Size Effect
For uniform tension and one applicable volume-flaw population, a simplified relationship is:
[
\frac{\sigma_2}{\sigma_1}=\left(\frac{V_1}{V_2}\right)^{1/m}
]
This is a conceptual first-pass relationship, not a finished-component design equation. Flexural specimens have nonuniform stress and require effective volume or effective surface calculations. Surface-controlled and volume-controlled failures require different treatment. Nominal outside volume is not a substitute for the effective stressed region, and scaling is invalid when the active flaw population changes.
Test Configuration Changes the Effective Stressed Region
| Test or Component Condition | Stressed Region | Main Interpretation Risk |
|---|---|---|
| Three-point flexure | Localized maximum-stress region | May sample a smaller critical region |
| Four-point flexure | Larger region under high bending stress | More opportunity to encounter a severe surface flaw |
| Uniaxial tension | Larger volume or surface under tension | Alignment and gripping become critical |
| Biaxial flexure | Surface area under multiaxial stress | Requires method-appropriate analysis |
| Finished component | Complex, nonuniform stress field | Geometry and contact stresses may dominate |
Surface Finish Can Override a Material-Level Comparison
As-fired and ground surfaces can activate different flaws. Grinding direction, diamond grit, material-removal history, polishing, chamfer quality, post-machining heat treatment where applicable, residual stress, handling, and packaging damage all matter. A polished test bar does not necessarily represent a ground bore, thin edge, or press-fit surface on the supplied part.
Reliability Requires More Than a Weibull Fit
Reliability assessment also needs the actual service stress field, temperature, humidity or chemistry, static or cyclic loading duration, subcritical crack-growth behavior, target survival probability, lot consistency, inspection resolution, possible proof testing, and design safety factors. Extrapolating a modest dataset to extremely low failure probabilities without uncertainty analysis creates false confidence.
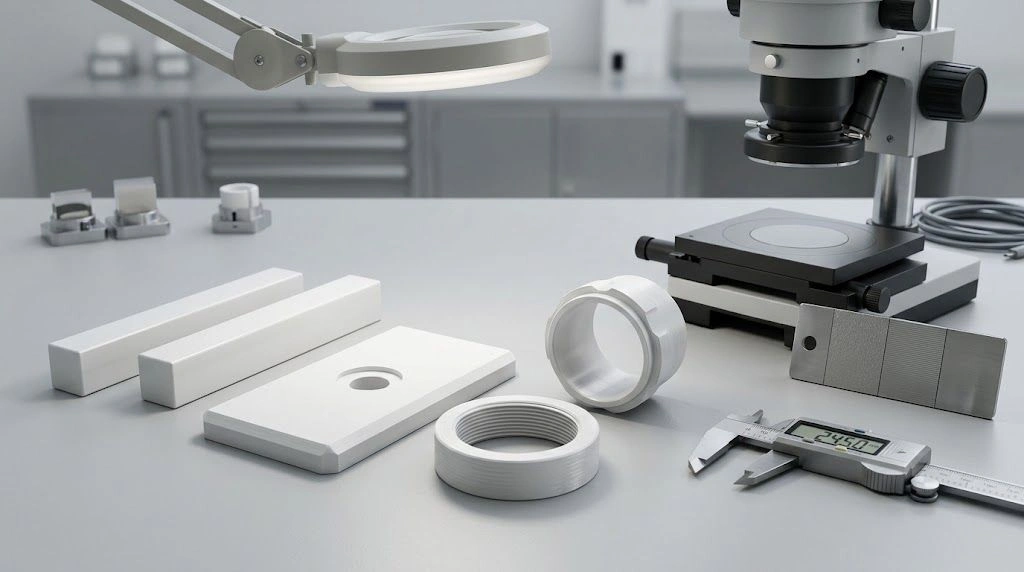
Transferring test-bar Weibull data to a component requires matching flaw populations, machining condition, stressed region, and service environment.
What Weibull Data Should Buyers Request?
A supplier comparison should include the underlying strength data and test conditions—not only an isolated modulus. Without traceable specimen, statistical, and fracture-origin information, the number cannot establish whether two suppliers tested comparable flaw populations.
Buyer’s Test-Report Checklist
- Exact material designation, composition, grade, density, and open porosity.
- Batch or lot identity, plus forming and sintering route where relevant.
- Test standard and revision.
- Loading configuration and specimen geometry.
- Surface preparation, grinding direction, edge preparation, and chamfer condition.
- Test orientation relative to forming or machining.
- Test temperature, atmosphere, and loading rate.
- Total specimens tested and number considered valid.
- Individual failure strengths or a traceable dataset.
- Weibull modulus (m) and characteristic strength (\sigma_0).
- Estimation method and any bias correction.
- Confidence bounds for both parameters.
- Fracture-origin classification.
- Censored, excluded, or invalid specimens and reasons.
- Goodness-of-fit or documented plot review.
- Evidence that the analyzed results represent one applicable flaw population.
- A statement separating typical data from guaranteed acceptance limits.
Copyable RFQ Language
Please provide the uniaxial strength and Weibull analysis for the proposed ceramic grade, including the test standard and revision, loading configuration, specimen geometry, surface and edge preparation, test orientation, batch identification, test environment, total and valid specimen counts, individual strength results, Weibull modulus, characteristic strength, estimation method, bias correction, confidence bounds, fracture-origin classification, and all censored or excluded results.
Copyable Drawing-Review Note
Please confirm whether the reported Weibull parameters represent surface-controlled, edge-controlled, or volume-controlled failures and whether the tested flaw population is applicable to the proposed component geometry and final machining condition.
Weibull parameters should be reviewed with part geometry, tensile-stress locations, surface finish, edge condition, inspection requirements, assembly loads, and operating environment. Include those details with the drawing when requesting custom ceramic parts so the data can be assessed against the actual component rather than used as an isolated supplier ranking.
Frequently Asked Questions
Does a higher Weibull modulus mean a stronger ceramic?
No. It means the tested strength values form a narrower distribution. Strength magnitude is described separately by characteristic strength, mean strength, or another defined statistic.
How many specimens are needed for Weibull analysis?
About 30 is a commonly cited rule of thumb, not a universal minimum. The required number depends on desired confidence, expected scatter, qualification purpose, batches, failure modes, and applicable standard.
Why does a larger ceramic component often have lower expected strength?
Under a valid weakest-link model, a larger highly stressed area or volume has a greater opportunity to contain a severe flaw. Scaling must use the effective stress field and applicable surface- or volume-flaw population.
Can two suppliers’ Weibull moduli be compared directly?
Only when grade, method, geometry, surface preparation, orientation, sample size, estimation method, fracture-origin population, environment, and confidence basis are aligned.
Can Weibull analysis guarantee component reliability?
No. It can support probabilistic engineering when the data and assumptions are valid. Reliability still depends on geometry, stress, surface condition, environment, loading time, subcritical crack growth, production control, inspection, and uncertainty.
Decision rule: Treat Weibull modulus as a descriptor of scatter for a traceable specimen and flaw population—not as an independent material constant, a strength value, or a shortcut to finished-component reliability.